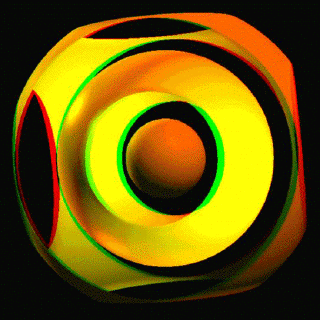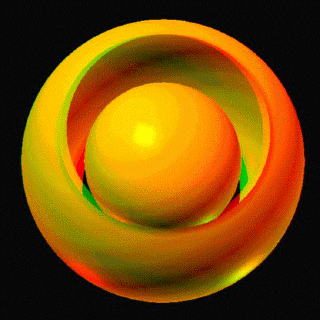

The data fed to SciAn was a file containing a 3-dimensional scalar field that represents the probability density for finding a nucleon at each point in space near the center of the nucleus. SciAn provides a simple mechanism for rendering the surface corresponding to any chosen contour of constant probability density, including lighting and shading, on a Silicon Graphics workstation. (This picture was made on an Indigo.)
The surface shown in the picture of Lithium-7 was drawn at a probability density that encloses the volume where there is more than a 90% chance of finding a proton or neutron. Although the nucleus is more like a fuzzy ball than a shiny object with a sharp surface, this density contour is roughly where most nuclear probes start to feel a significant influence from the nucleus.
My recollection is that the density distribution was generated in a simple deformed model rather than making use of the high quality microscopic densities that have been developed over the past decade or so. [See Nucl. Phys. A563, 387 (1993) for the latest incarnation.] I am pretty sure it was based on a good g.s. spherical density and a deformation length that gives the known quadrupole moment.

