Back to the Overview.
Aerodynamic drag forces depend on the size and shape of the object, the density and viscosity of the fluid medium, and the speed of the fluid flow around the object. The standard approach [1] is to make explicit some of the dependences on these variables and hide the rest in an empirical drag coefficient. (This study will completely ignore the Magnus Effect, the cause of sideways forces associated with rotation of the moving body which are essential for a proper treatment of the flight of a baseball.)
The drag force is always in the direction opposite to the
velocity (that is,
![]() )
and has a magnitude given by
)
and has a magnitude given by
|
Jump to Section 1.A:
Tables and graphs of standard data |
What value of L you use is defined by the convention adopted for
the measured values of CD.
For example, the area L2
might be
![]() for a sphere or disk.
Operationally, one measures Fdrag for a given set of
parameters and deduces the value of CD by using this formula
with a specific definition of L. You must know what definition
was used when CD was determined in order to use
some graphed or tabulated data in the formula.
for a sphere or disk.
Operationally, one measures Fdrag for a given set of
parameters and deduces the value of CD by using this formula
with a specific definition of L. You must know what definition
was used when CD was determined in order to use
some graphed or tabulated data in the formula.
The Reynolds number is a dimensionless parameter defined by

Our parameterization
For our purposes it will be convenient to isolate the dependence of
the drag force on one dynamical parameter, the velocity v.
For a particular fluid medium (assumed to have a density and viscosity
that does not depend on position, a condition violated if the problem
extends over a large range of altitudes in the atmosphere) and an object
of fixed size and shape, we will define
| (2) |
My emphasis here will be on analytic solutions for the free-fall problem for forces with simple forms for K(v).
In one dimension (with ``down'' positive), the free fall of a
body is due the the net force given by
Special cases that can be solved analytically - and which also make good approximations in certain real situations - are K(v) = K1/v and K(v) = K2. The first produces a drag force linear in v, typical for very low speeds or high viscosity (i.e. small Re), while the second produces a quadratic dependence on the speed as is commonly encountered for larger Re. Both of these situations can be seen in the CD graphs in Section 1.A and are explained in Section 1.B.
|
Jump to Section 1.B:
Physical rationale for linear and quadratic drag regimes |
Real objects
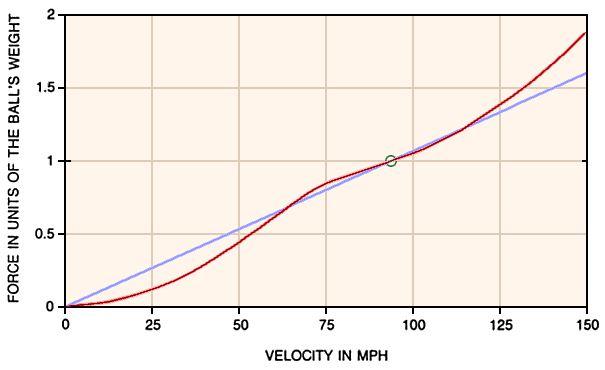
An object like a baseball, although essentially spherical, has surface defects (stitching) that make it different from the perfectly smooth sphere used for the measurements that produce the CD graph in Section 1.A. Similarly, since we are interested in its behavior at quite large Reynolds numbers, the special case of the Stokes formula would not apply even if the ball were smooth. For most real objects, one has no choice but to use empirically determined parametrizations of the drag force or of K(v) or do a very sophisticated model calculation of the flow around the object. An example of data for drag forces on a baseball is given below.

Note that Fdrag is quadratic for low speeds and then goes through a transition region to a different quadratic dependence at high speeds. The region of most interest for the game of baseball happens to be where the forces are particularly complicated, and this is no accident -- it is due to the design of a ball that can be used to throw curves and other pitches between 70 and 100 mph. These data also tell us that numerical solutions are the only feasible approach to the analysis of baseball. If I did have to make analytic estimates, I would use the linear drag approximation that gives the correct terminal velocity, the light blue line shown in the figure.
Next, the General Solution for Simple Drag Parametrizations.
Jim Carr